This Client Level Data (CLD) Insight report looks at how the gender split of people accessing long-term support compares to the overall population in England and is based on data published in July 2024.

The latest population estimates for adults aged 18 years and over and resident in England showed that there were approximately 22.1 million men living in England and 23.6 million women in 2023.
Figure 1 shows the percentage of the population that were men and women for working age adults (age 18-64 years) and older adults (age 65+).
We recognise that there will be an additional number of adults that do not identify as male or female, however there are no comparable population estimates available by age currently and therefore we have not been able to include them in this analysis.
We see that 50.8 per cent of working age adults were women, and 49.2 per cent were men. The female percentage of the population was higher in the older age group at 54 per cent. Additionally, we know that the male life expectancy is 78.8 years compared to 82.8 years for females.
This is important in the context of long-term support, as we know that older adults make up the majority of people accessing care and therefore, we would also expect a higher number of women to be accessing long term support than men.
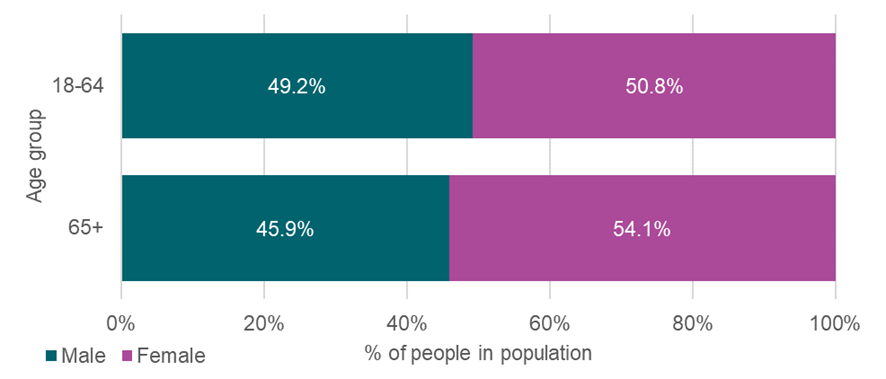
Figure 2 shows the total number of people accessing long-term support in all settings by gender. Overall, there are over 80,000 more women than men accessing long term support, with women making up 56.1 per cent of the overall number, and men 43.4 per cent. The number of people accessing long-term support that did not identify as male or female is small at less than 0.1 per cent of the total, with an additional 0.4 per cent with no known gender.
There is some variation between support settings with around 46,600 more women than men accessing support in the community, 27,900 more in residential care and 10,200 more in nursing care.
Figure 2: Number of people accessing long-term support, by gender (March 2024)
| Gender | Number of people in long-term support | % of total in long-term support |
|---|---|---|
| Female | 370,850 | 56.1% |
| Male | 286,415 | 43.4% |
| Other | 290 | 0.0% |
| Unknown | 2,950 | 0.4% |
Due to the difference in the cohort size for each support setting (denoted by n in figure 3), we can use the percentage of people to explore gender differences between them rather than absolute numbers.
The largest numbers are supported in the community and 54 per cent of those were women, compared to 45 per cent of men. This is close to the gender split seen in the general population for people aged 65 and over.
However, the percentage of women is higher in other settings, with the highest percentage of women in residential care (60.2 per cent), followed closely by nursing care (59.2 per cent).

With an ageing population, it is important to understand who is accessing long term support and how this population may increase or decrease in future years to assess how needs for support may change in the future.
Data in this briefing
Adult social care in England, monthly statistics: July 2024
Estimates of the population for England and Wales - Office for National Statistics
This briefing is one of a number of CLD insights available on the Client Level Data homepage.
Highlighted pages
Client Level Data
The Client Level Data (CLD) collection is the first national collection of social care records, covering requests for support, assessments, reviews and services provided or commissioned by councils as part of their duties under the Care Act 2014.
How does the setting for long-term support vary between age groups?
We know that as a person get older, they are more likely to experience adverse health conditions and therefore have more health and care needs. It’s therefore not a surprise that accessing long-term support is more common among older people, with around 60 per cent of those accessing it being over the age of 65.
How does the ethnicity of people accessing long-term support compare to the wider population?
This Client Level Data (CLD) Insight report looks at how the ethnicity of people in long-term support compares to the overall population in England and is based on data published in July 2024. Note that in the Client Level Data (CLD) around 6% of records had unknown ethnicity and these have been excluded from the analysis.