Nottinghamshire County Council has undertaken a project to map mobile connectivity coverage in the County.
Summary
Nottinghamshire County Council has undertaken a project to map mobile connectivity coverage in the County. Working in partnership with Birmingham City University (BCU) and the seven district and borough council waste teams, the council deployed a monitoring device and collected live 4G and 5G mobile connectivity data for all four Mobile Network Operators (MNOs) in the UK. From this, the council identified ‘not spots’ and areas of poor coverage, as well as areas with moderate and excellent signal strength.
A publicly available colour-coded mobile connectivity map showcasing the coverage available has been published on the council’s webpage. The insights from the project will be critical in helping the council identify targeted interventions to improve connectivity across the County.
The challenge
Like all councils across the country, Nottinghamshire suffers from widely varying levels of mobile signal connectivity. Within our towns, and especially across our widespread rural communities, mobile coverage varies between high speed 5G, 4G and poor or non-existent 2G/3G reception, often within the same village or neighbourhood. Whilst network operators provide high level coverage maps there are many instances where the data does not accurately reflect the ‘real world’ connectivity at street level, nor offer the level of granularity needed for informed decision making and intervention.
One of the key requirements for local residents, businesses and organisations is having access to good mobile connectivity. This is particularly important as modern-day society becomes increasingly reliant on devices that consume large amounts of data over the internet thus creating more demand on our mobile infrastructure in the process. Estimates show that there has been a significant growth in the use of mobile devices, with current estimates indicating that there are around 60 million smartphone devices in the UK. The rise of ‘Internet of Things’ devices and other smart devices will also grow significantly over the next few years, for example through the increasing usage of digital signage for Traffic Management, Electric Vehicle Charging Points, GPS tracking, autonomous vehicles and so forth. Having strong and reliable mobile connectivity is therefore important for modern living.
This study prioritised the identification of 4G and 5G coverage issues within Nottinghamshire pinpointing areas of weak signal. The study mapped the coverage of all four MNOs, Vodafone, EE, O2 and Three across all seven districts and boroughs in the County: Ashfield, Bassetlaw, Broxtowe, Gedling, Mansfield, Newark and Sherwood as well as Rushcliffe. This survey has enabled us to gather detailed and up-to-date network coverage. This is pivotal in understanding which areas in the County require improvement in mobile connectivity.
Methodology
Birmingham City University built a network probe consisting of four unrooted smartphones, each connected to a different Mobile Network Operator (MNO). A bespoke mobile application was installed on each of the phones, which, when active, constantly logged app-level information. Secure software was installed on each phone to enable remote control and to send system updates as required. Additionally, to monitor the coverage progress, BCU developed a web application, which enabled live monitoring as well as an historical view of the network coverage. The devices transmitted the collected data every second to the cloud server if there was a network connection. If a network connection was not available, the data was saved locally on the devices in a buffer, and then transmitted as soon as connection became available.
The configured smartphones were then packaged into a 3D-printed box and deployed on refuse vehicles’ dashboards. The first deployment took place in September 2022. The box was designed to enable simultaneous charging of the devices and also to offer low signal attenuation. These considerations were essential in ensuring continuous coverage and mapping without interruption.
The data was collected within a single district or borough at a time. Once sufficient data was collected in each area, the Smartphones were then handed over to the next district/borough. This process was repeated until mobile data was mapped in each district and borough to help NCC understand 4G and 5G mobile connectivity across the entire County.
We received £20,000 of funding from the Local Government Association as part of its Digital Pathfinder grant funded programme which was spent on the design and the production of the device, as well as the monitoring toolkit. It also covered the staff time of four researchers at the University, to monitor the device and troubleshoot any issues, delivering updates to the technology when necessary.
Outputs
Over the 18-month survey period, we covered 7,723 roads in the districts and boroughs of Nottinghamshire, which needed more than 4000 hours of driving. To cover the region at high resolution, we accumulated around 7.7 million data points.
Not-spots across the County were identified – these are areas which lack sufficient coverage and have a signal strength of less than 125 decibel milliwatts (dBm) coverage. This means that people in these areas, or those who travel across them, cannot make phone calls, send texts messages, or access the internet through mobile networks reliably. The table below presents a guide of colour codes we used in the connectivity map as well as implications for network performance from not-spots (no signal) to excellent.
Table 1: Signal strength guide
| Not-spots | Bad to poor | Moderate to good | Excellent | |
|---|---|---|---|---|
| Reference Signal Received Power (RSRP) | More than or equal to -125 dBm | More than -125 dBm, less than or equal to -121 dBm | More than -121 dBm, less than -99 dBm | More than or equal to -99 dBm |
| Implication | No signal predicted | Reliable signal unlikely. However, it can still support voice calls and web-services but likely with interruptions and high latency. Both 4G and 5G can be unstable under this quality of coverage. 5G users may experience frequent handover events and go through "flapping" periods, while a 4G user will likely be adversely impacted in terms of low data rate and excessive latency. | Likely to have good coverage and receive adequate data rates to support web services, voice calls (including Voice over Internet Protocol (VoIP)), video calls and so on without interruption and with acceptable speed. Strong amber coverage, closer to -120 dBm, can experience minor interruptions to video conferencing and applications with high data rate demands. | Likely to have great coverage and to receive an enhanced data rate, such as 4K streaming, video gaming and so on particularly under 5G connections. 4G can still support high-resolution video streaming, delivering consistent speeds of around 20 to 30 Mbps. In contrast, 5G under this quality of coverage can reach anywhere between 200 and 300 Mbps, enabling the most demanding applications, including simultaneous 4K streaming. |
Initial findings indicated that ‘not spots’ exist in both urban and rural areas, such as Mansfield and Newark-on-Trent. Not spots were more present in rural and semi-rural environments. O2 has the most promising picture, with fewer not-spots across both 4G and 5G technologies compared to the other MNOs. It should be noted that 5G whilst not as widely present as 4G still presented not spots and poor signal areas.
Figure 1: Overall picture of where poor signal and 4G and 5G not-spots are located - red data points signify poor signal, blue signifies not spots
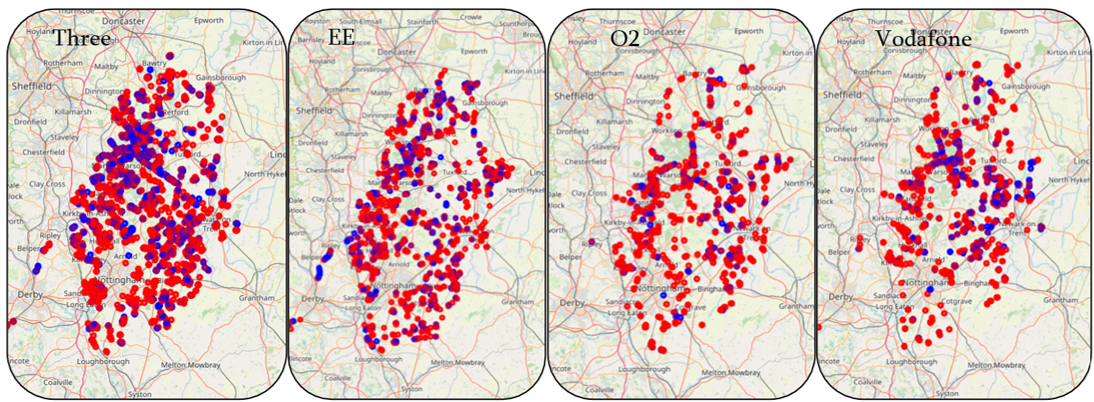
The figures show Three with the most not spots or bad coverage areas. Whilst Three has good 5G to 4G ratio, it still lacks moderate or excellent coverage in several areas, which can make deploying use cases which require low latency and reliability difficult. O2 on the other hand has the most promising picture, with fewer not-spots across both 4G and 5G technologies. The majority of these instances occur around the cell edges, primarily due to distance-based fading. Less frequently, they can be found within the central regions of the cells, caused by shadowing effects, multi-path interference, or a combination of both.
Figure 2: Overall picture of where poor signal and 4G not-spots are located
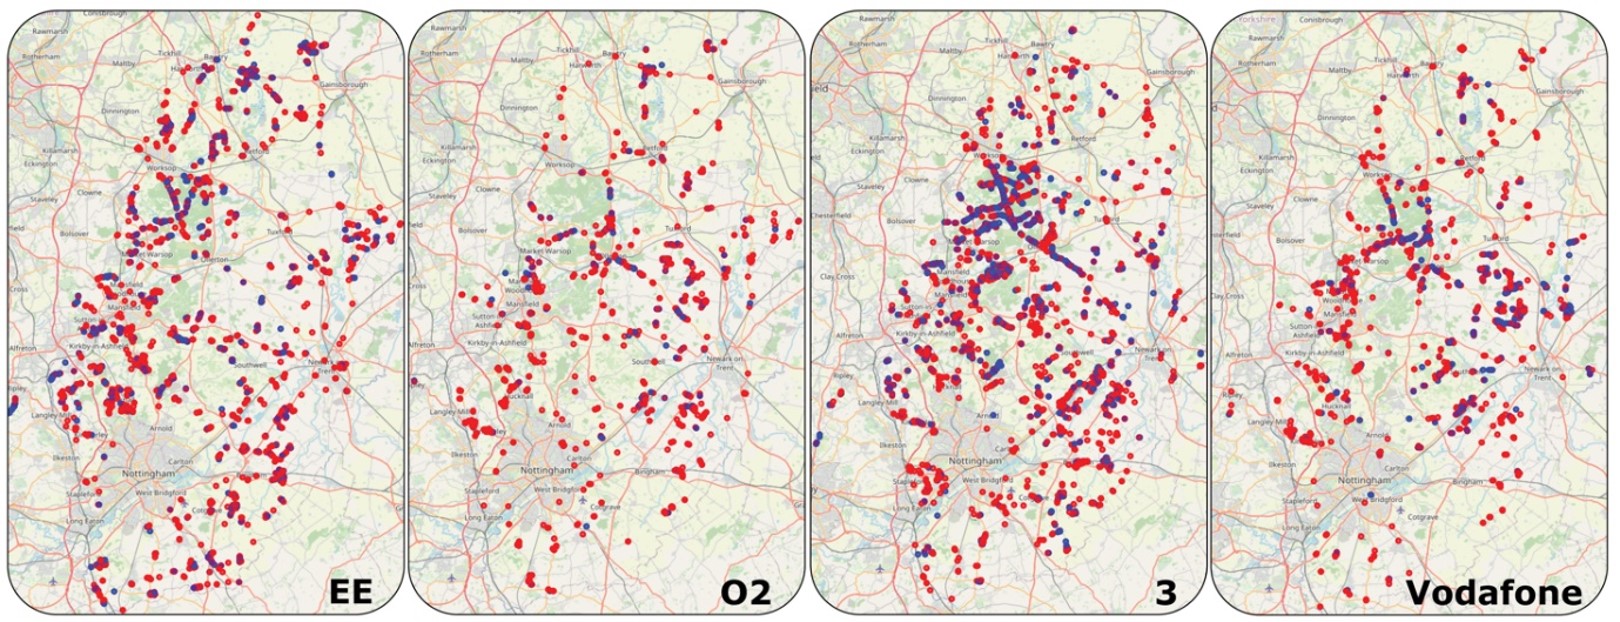
Figure 3: Overall picture of where poor signal and 5G not-spots are located
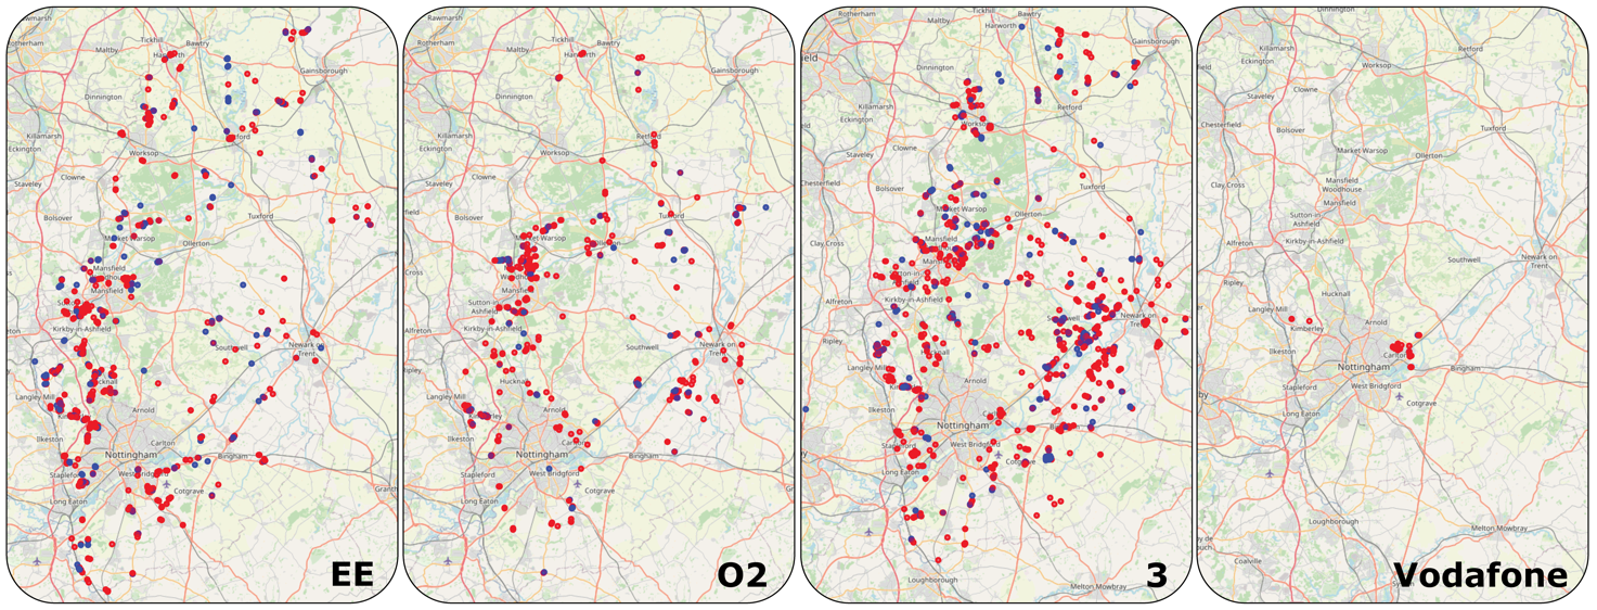
The images show the footprints of poor signal and not-spots regions under 4G and 5G, respectively. 5G not-spots are relatively limited compared to 4G technology, even for O2, which has achieved 47 per cent 5G network coverage in the mapped area. Out of the combined 4G and 5G collected data across all four MNOs, approximately 3.1 per cent were identified as not spots. Note that due to the weak presence of 5G coverage from Vodafone, we detected fewer instances of poor coverage and signal strengths below the -125 dBm mark.
Lessons learned
Without exception, we found all districts refuse managers cooperative and understanding of the project's scope and its objectives. However, we learned that it is important to engage with the collaborators in advance, giving them sufficient time to plan routes and allocate resources effectively.
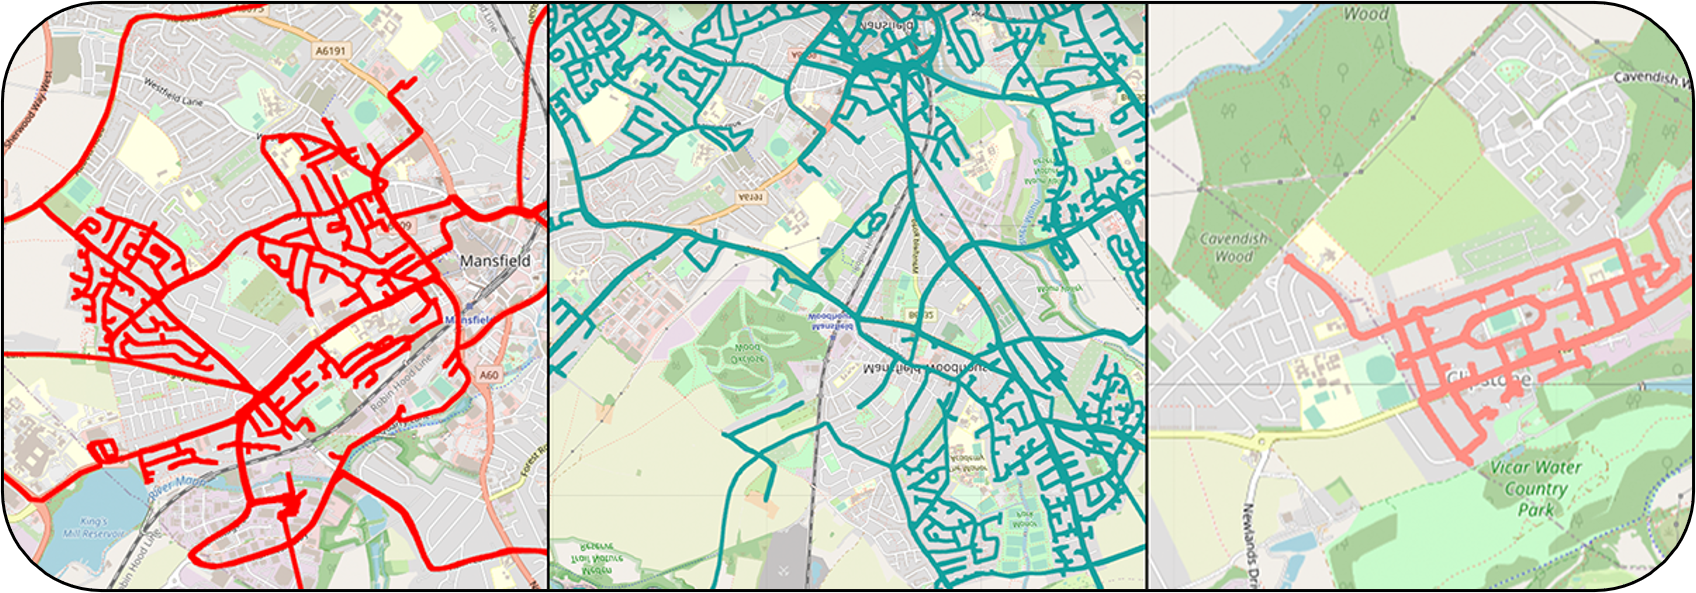
We also received weekly progress monitoring reports from BCU which included up-to-date coverage maps. This helped monitor any gaps and make interventions to minimise the gaps in the data collection. This also reduced the likelihood of the routes being duplicated. The images below are an example of these weekly reports down to a street level.
Figure 4: Weekly reports representing the progress of monitoring on street level accuracy
Although most of the data collection was achieved through refuse vehicles operated by districts, there were some areas that were missed in the initial routes taken by refuse vehicles. At the end of the project in March 2024, we completed some drive tests to fill some of the gaps. Such infill is sometimes required as refuse vehicles have specific routes on schedule, which makes it difficult to cover these gaps. This helped us acquire a more complete picture of coverage in Nottinghamshire County.
Next steps
Nottinghamshire County Council will identify areas in the County that have poor or no mobile connectivity coverage. These areas will be prioritised for interventions and Officers will seek to lobby the MNOs and other partners to drive improved mobile connectivity in Nottinghamshire. We will consider suitable alternatives.
Looking further ahead, the Council will consider other opportunities and look to replicate the mobile connectivity mapping project in the future to maintain and update the data that has been gathered within the County. This will also mean we can track developments and changes in mobile connectivity as 6G is trialled and previous generations of mobile communications (e.g. 3G) become obsolete.
We will also be developing how we map against full fibre and fixed broadband availability so that we can get a complete picture of internet access, total not spots, or extremely slow speeds for use across sensors and mapping.
Contact
Emma Branston
Digital Project Officer
Digital Connectivity Team
Nottinghamshire County Council
[email protected]
0115 977 4863
Further information
More information about Nottinghamshire County Council’s mobile map is available on their website.